August was a fairly average month for weather in Saskatchewan.
Environment Canada Meteorologist Terri Lang compiles monthly weather statistics from weather stations around the province.
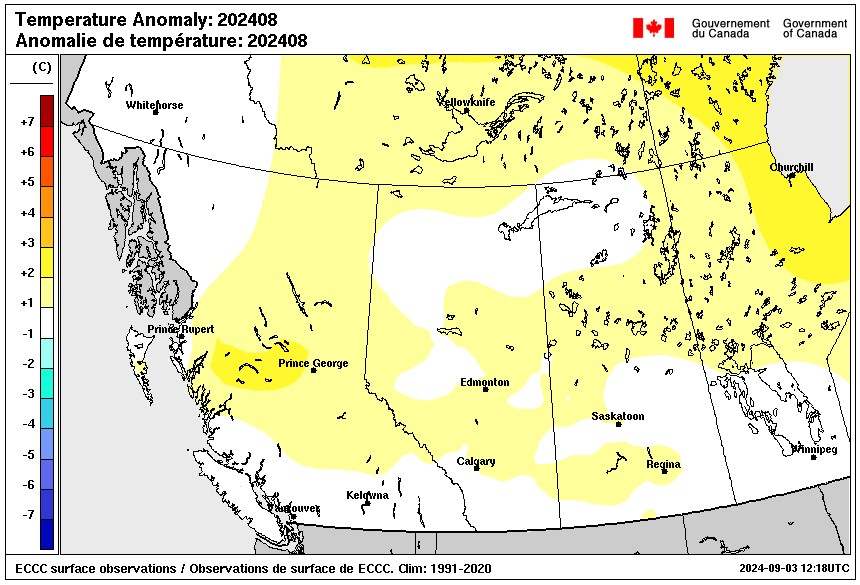
Lang says there wasn’t a lot of variation with temperatures, as all weather stations recorded temperatures within their respective averages for the month.
“When all the numbers were added up and averaged, we came out pretty close to 30-year average temperatures. When we do the rankings, the rankings seem high only because when we compare the coldest August we’ve ever recorded to and the warmest August we’ve ever recorded, there isn’t a whole lot of variation,” said Lang.
| Station | Monthly Mean Temperature/Température moyenne mensuelle C | Msg | Normal/ Normale | Departure from Normals/Différence de la normale | Rank/Rang | Years of Data/Nombre d’années |
| ESTEVAN | 18.6 | 0 | 18.6 | 0.0 | 53 warmest/le plus chaud | 109 |
| KEY LAKE | 15.9 | 0 | 14.7 | 1.2 | 12 warmest/le plus chaud | 48 |
| LA RONGE RCS | 17.6 | 0 | 16.1 | 1.5 | 10 warmest/le plus chaud | 60 |
| MEADOW LAKE | 16.7 | 0 | 15.5 | 1.2 | 18 warmest/le plus chaud | 76 |
| MOOSE JAW CS | 18.8 | 0 | 18.9 | -0.1 | 44 warmest/le plus chaud | 130 |
| NORTH BATTLEFORD RCS | 17.4 | 0 | 16.9 | 0.5 | 30 warmest/le plus chaud | 83 |
| PRINCE ALBERT GLASS FIELD | 17.2 | 0 | 16.7 | 0.5 | 37 warmest/le plus chaud | 140 |
| REGINA RCS | 19.0 | 0 | 18.1 | 0.9 | 28 warmest/le plus chaud | 131 |
| SASKATOON RCS | 18.6 | 0 | 17.6 | 1.0 | 19 warmest/le plus chaud | 128 |
| SWIFT CURRENT | 19.5 | 0 | 18.2 | 1.3 | 19 warmest/le plus chaud | 139 |
| YORKTON | 17.7 | 0 | 17.1 | 0.6 | 36 warmest/le plus chaud | 115 |
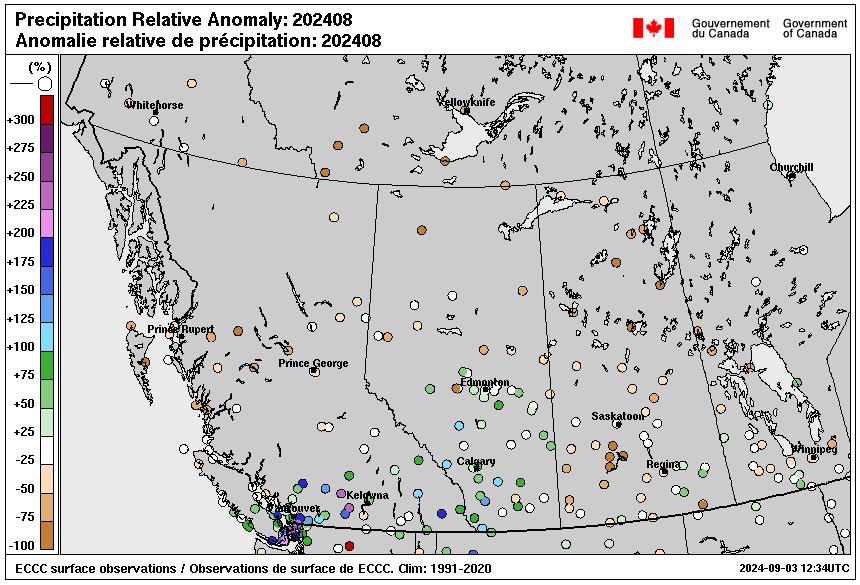
Lang says precipitation was lacking last month with Key Lake and La Ronge recording their driest months ever. The exception was a low pressure system that swept through southern Saskatchewan towards the end of the month, and some thunderstorms in the southeast that brought some moisture.
| Station | Monthly Precipitation Total/Hauteur de précipitations mensuelles (mm) | Msg | Normal/ Normale | Percentage of Normal/Pourcentage de la normale | Rank/Rang | Years of Data/Nombre d’années |
| ESTEVAN | 33.9 | 0 | 51.7 | 66 | 44 driest/le plus sec | 111 |
| KEY LAKE | 16.9 | 0 | 66.9 | 25 | 2 driest/le plus sec | 47 |
| LA RONGE RCS | 10.7 | 0 | 60.6 | 18 | 3 driest/le plus sec | 59 |
| MEADOW LAKE | 32.5 | 0 | 62.7 | 52 | 21 driest/le plus sec | 75 |
| MOOSE JAW CS | 30.6 | 0 | 39.1 | 78 | 59 driest/le plus sec | 133 |
| NORTH BATTLEFORD RCS | 44.1 | 0 | 57.9 | 76 | 40 driest/le plus sec | 83 |
| PRINCE ALBERT GLASS FIELD | 36.5 | 0 | 61.6 | 59 | 53 driest/le plus sec | 140 |
| REGINA RCS | 34.3 | 0 | 44.8 | 77 | 63 driest/le plus sec | 139 |
| SASKATOON RCS | 50.7 | 0 | 42.6 | 119 | 41 wettest/le plus élevé | 128 |
| SWIFT CURRENT | 15.3 | 0 | 41.5 | 37 | 26 driest/le plus sec | 139 |
| YORKTON | 42.3 | 0 | 62.2 | 68 | 49 driest/le plus sec | 116 |
Lang says there wasn’t a lot of lightning activity last month which speaks to how dry it was.
“It was about 72 per cent of average in August across Saskatchewan, and that’s the sixth lowest in about 22 years of record; we don’t have a whole ton of records but when you plot…the number of lightning strikes from year-to-year it’s decreasing across the Prairies.” she said.